Introduction
Before beginning to code any algorithm, programmers use a range of techniques to determine how the algorithm will work and what different programming statements they will need.
Another design technique available to the program designer is the flowchart diagram.
A flowchart is a common set of symbols used worldwide that the British Computer Society has defined to mean the same thing.
In this lesson, we’ll learn about:
- What a flowchart is
- What the standard symbols of a flowchart are
- How flowcharts relate to pseudocode

What a Flowchart Is
We have seen how code can be expressed as pseudocode, which is a simple description of how a program functions.
The code below shows a very simple piece of pseudocode for entering two numbers into a program, multiplying them together, and then outputting the result.
firstNumber ← USERINPUT
secondNumber ← USERINPUT
result ← firstNumber * secondNumber
OUTPUT result
Now, while this code might make sense to a programmer, it might not make any sense to someone with no programming experience at all.
What a Flowchart Is
Sometimes, other people, who may not be software engineers, need to see what a program aims to do.
Such people may be the client, the program’s end-user, a project manager, or a business analyst.
They would not be able to read and understand pseudocode or actual code, especially code that becomes more complex.
That is why flowcharts exist – they are a simple way for non-programmers to see how a piece of software works.
An additional use for flowcharts is by programmers to quickly see how programs should work and help solve problems in code.
What a Flowchart Is
Flowcharts are themselves a language.
Anybody who has seen a flowchart will be able to read, follow and understand it. That makes flowcharts a very powerful tool for communicating ideas.
There are many tools available for constructing flowcharts.
Two of the most popular are Microsoft Visio and the online tool https://www.draw.io/.
We will look at the symbols used as well as how to construct flowcharts from pseudocode in the following sections.
What a Flowchart Is
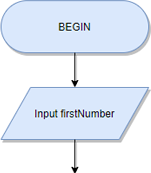
The flowchart for the pseudocode seen previously is shown in Figure 1 below.
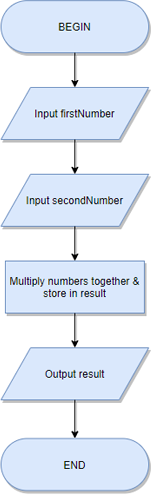
firstNumber ← USERINPUT
secondNumber ← USERINPUT
result ← firstNumber * secondNumber
OUTPUT result
Flow Chart Symbols
All flowcharts use the same symbols for different parts of the program.
These symbols have been approved by the British Computer Society (BCS) and are standard across the world:
- Connector
- Terminal
- Input/Output
- Process
- Decision
- Sub-Program
Let’s look at each of these in more detail.
Flow Chart Symbols
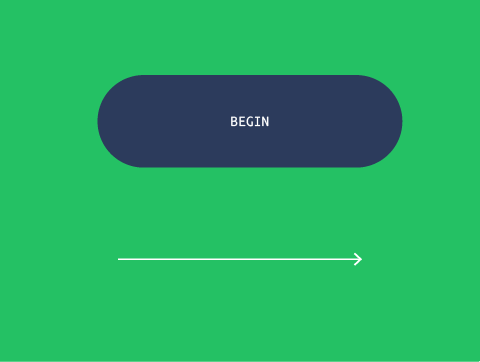
Terminal
These symbols represent the start and end of our flowchart (or program).
Both Begin and End use the same shape which is a flattened circle with a connector either going out of it (Begin) or into it (End).
Connector
These show the direction of the flow in your diagram, sometimes known as the “flow of control”.
These will always start at one symbol and end at another with an arrowhead showing the direction of flow.
Flow Chart Symbols
Input/Output
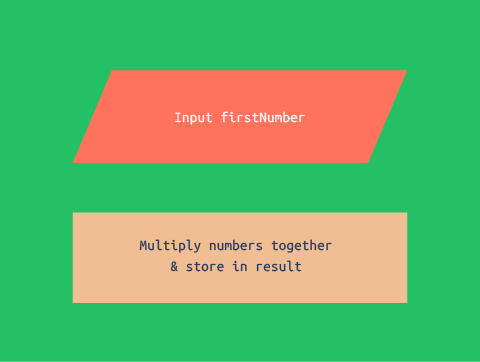
Just like begin and end, Input and Output use the same shape, a flattened rectangle (or parallelogram).
You can tell which is input and output by the text inside the rectangle.
Process
A process is where your program does something that is not input or output.
A process could be a mathematical calculation, a database check, or searching for something in a list.
In a flowchart, a process uses a square box with text describing what the process does.
Flow Chart Symbols
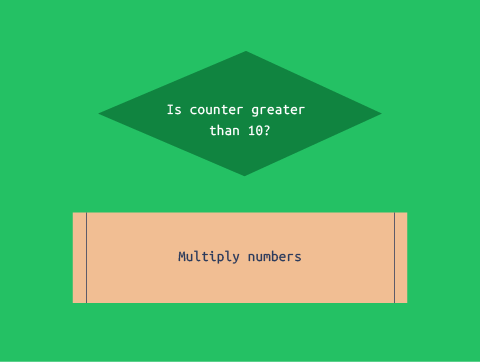
Decision
A decision is drawn as a diamond that will always have one connector going into it and two connectors coming out of it.
The decision represents a question that your code is asking (or an If statement in your code). The two connectors coming out are what to do if the answer is Yes, and what to do if the answer is No.
Sub Program
A sub program is another process that is defined elsewhere. This might have its own separate flowchart.
In programming, this could represent a subroutine or function. This is like a block of code that is designed to perform a frequently used process.
How Flowcharts Relate to Pseudocode
Flowcharts are a simple graphical way of representing pseudocode as a drawing.
It should be possible for our flowchart to almost exactly match our pseudocode.
For example, take a look at the pseudocode we used in part 1 of this lesson. We will see how the flowchart matches the pseudocode.
firstNumber ← USERINPUT
secondNumber ← USERINPUT
result ← firstNumber * secondNumber
OUTPUT result
How Flowcharts Relate to Pseudocode
We can start by looking at line 1 of the pseudocode.
firstNumber ← USERINPUTThis matches the following parts of the flowchart:
Notice we have the BEGIN and the INPUT. The begin just represents the start of the program. Sometimes in pseudocode we’ll include a BEGIN at the start of the pseudocode too.
firstNumber ← USERINPUT
secondNumber ← USERINPUT
result ← firstNumber * secondNumber
OUTPUT result
How Flowcharts Relate to Pseudocode
Now we can look at line 2 of the pseudocode.
secondNumber ← USERINPUTThis matches the following parts of the flowchart:
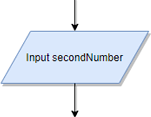
Again, this matches the pseudocode very closely. We have input the second number and stored it in a variable called secondNumber.
firstNumber ← USERINPUT
secondNumber ← USERINPUT
result ← firstNumber * secondNumber
OUTPUT result
How Flowcharts Relate to Pseudocode
Now, we can look at line 3 of the pseudocode.
result ← firstNumber * secondNumberThis matches the following parts of the flowchart:
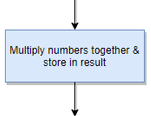
While this looks a little different, as the flowchart is more descriptive, you can see it does the same thing.
We multiply firstNumber and secondNumber and store the result in a variable called result.
firstNumber ← USERINPUT
secondNumber ← USERINPUT
result ← firstNumber * secondNumber
OUTPUT result
How Flowcharts Relate to Pseudocode
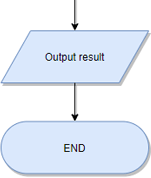
Now, we can look at line 4 of the pseudocode. Our final line of code.
OUTPUT resultThis matches the following parts of the flowchart:
firstNumber ← USERINPUT
secondNumber ← USERINPUT
result ← firstNumber * secondNumber
OUTPUT result
How Flowcharts Relate to Pseudocode
This flowchart matches our pseudocode closely. We simply output the result to our user and the program ends.
Much like with the BEGIN, the END in a flowchart just shows the end of the diagram, and we sometimes have an END statement at the end of our pseudocode too.
It’s easy to see here how our flowchart matches our pseudocode almost exactly.
It just presents it in an easier-to-understand graphical form.
firstNumber ← USERINPUT
secondNumber ← USERINPUT
result ← firstNumber * secondNumber
OUTPUT result
Lesson Summary
Flowcharts are a simple graphical way for a non-specialist to look at pseudocode.
All flowcharts use the same symbols for different parts of the program. These include:
- Connectors
- Begin / End symbols
- Input / Output symbols
- Process symbols
- Decision symbols
It should be possible for our flowchart to almost exactly match our pseudocode.