Introduction
Flowcharts are one of the most popular tools for planning and designing processes, especially in the world of IT.
They allow you to picture the steps of a task or system in a clear, structured way—almost like a roadmap that shows you where each decision leads.
In this lesson, we’ll learn about:
- The components of flowcharts
- The type of software that can be used to create a flowchart
- Advantages and disadvantages of flowcharts
- Creating an original flowchart for a given scenario

What is a Flowchart?
A flowchart is a diagram that shows the steps, decisions, and possible paths in a process.
Think of it as a visual representation of how something works.
Each shape in a flowchart plays a specific role, whether it’s a starting or ending point, a process step, or a decision that needs a “yes” or “no” answer.
Flowcharts are used in many areas of IT to plan the structure of programs or systems before anyone writes the actual code.
They’re also handy in other subjects and fields—such as science experiments or project planning—because they make complex processes easier to follow.

Components of a Flowchart
Flowcharts are made up of different shapes connected by arrows.
These standard symbols make it easier for everyone to read and understand the flowchart.
Because they are recognisable and consistent, flowcharts made by one person can be read by many others without confusion.
The standard symbols used are:
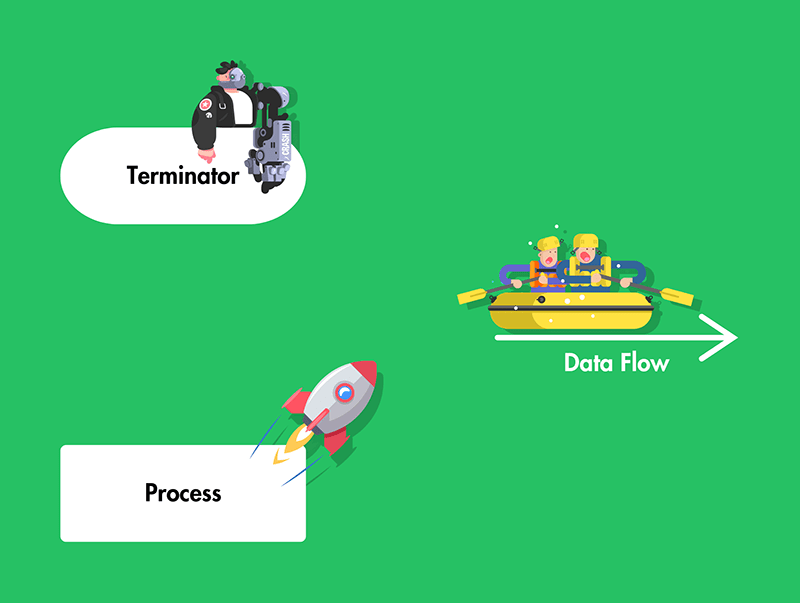
- Terminator (Start/End)
- Data Flow
- Process
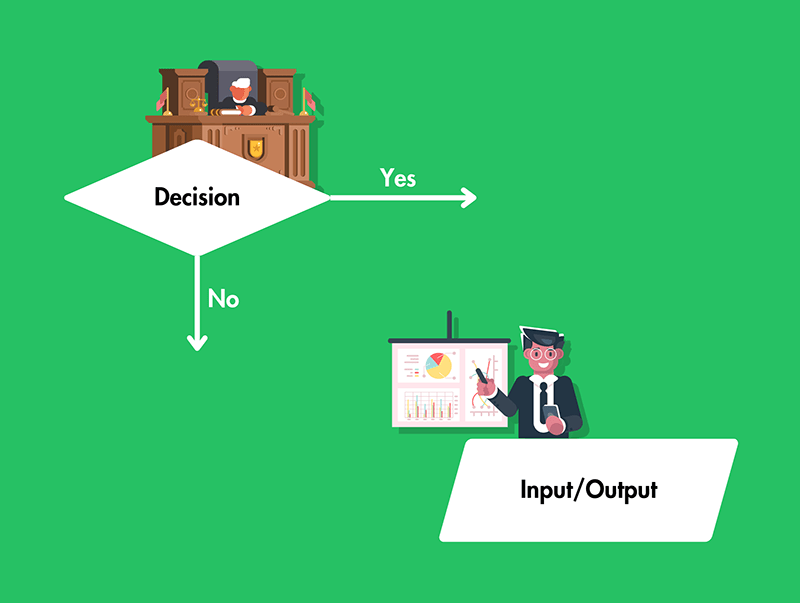
- Decision
- Input/Output

Components of a Flowchart
Terminator (Start/End)
This shape is usually an oval or rounded rectangle.
It tells you where the flowchart begins (Start) and ends (End).
Data Flow
Arrows show the direction of the process flow.
They help you trace the path from one step to the next.
Process
This shape is usually a rectangle.
It represents an action or step in the process.
Examples could include “Add two numbers” or “Display message.”
Components of a Flowchart
Decision
This shape is usually a diamond and represents a point where a question is asked.
The flow can split into different paths based on the answer—for example, “Is the user logged in? Yes or No?”
Input/Output
This shape is sometimes a parallelogram.
It indicates where data is entered into or returned from a process, like “Enter username” or “Show results.”
Quick Quiz: What Are Flowcharts?
Types of Software for Creating Flowcharts
Flowcharts can be drawn by hand using pencil and paper, which is often a quick way to sketch out a rough plan.
However, when you need to share a flowchart or include it in a project document, specialised software makes the job a lot easier.
Programs like Microsoft Visio, Lucidchart, or draw.io offer ready-made symbols and templates to help you create clean, professional-looking diagrams.
Some of these tools also include extra features like collaboration options, so multiple people can work on a flowchart at the same time.
For students on a budget, many free online tools are available—just do a quick search and you’ll find plenty of options.

Advantages of Flowcharts
Clarity
They use simple shapes and arrows to outline each step, making the whole process easy to follow.
Organisation
By breaking down big tasks into smaller parts, it’s easier to see what needs to be done in each step.
Error Detection
When you plan a system with a flowchart, you might spot mistakes or potential problems before you start building.
Ease of Communication
Flowcharts make it much simpler to explain an idea to other people—especially those who might not have the same level of technical knowledge.

Disadvantages of Flowcharts
Time-Consuming to Update
If your system or process changes, you might need to redraw or update your flowchart. This can be time-consuming, especially if you’re working with a large or complicated chart.
Can Get Complex
For very large processes, a flowchart can become crowded and confusing. It might be hard to fit everything neatly on a single page, and the diagram might stop being easy to read.
Limited Detail
While flowcharts do give an overall picture, they might not show all the tiny details. For example, you might need extra notes or separate documents to explain specific steps.
Quick Quiz: Flowchart Software, Pros and Cons
Creating a Flowchart for a Scenario
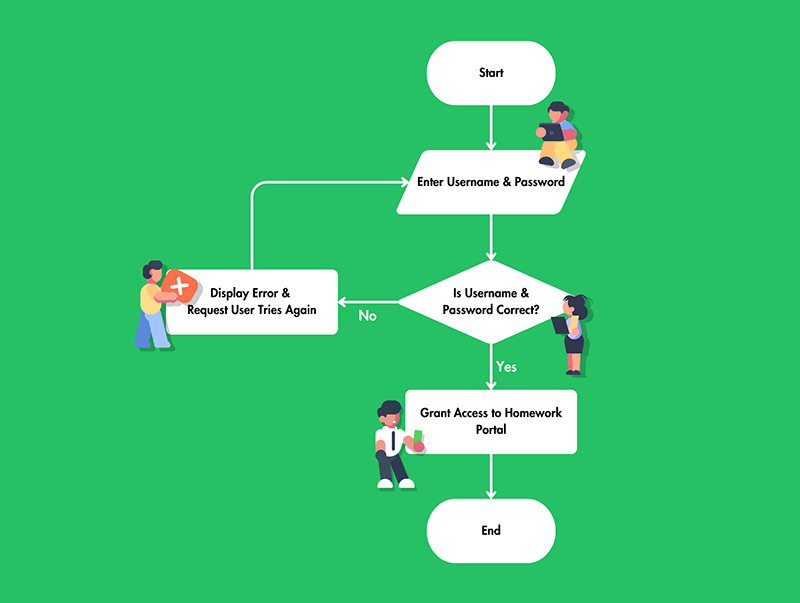
Let’s say you’ve been asked to design a login system for a school website.
Students need to type in their username and password to gain access to their homework portal.
Let’s look at how you could turn that into a flowchart step by step.

Creating a Flowchart for a Scenario
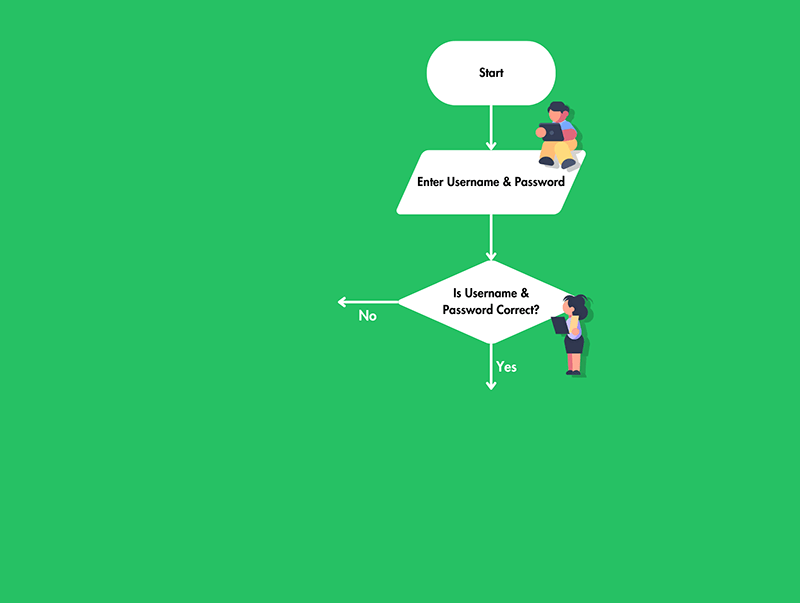
Step 1
Draw an oval or rounded rectangle and label it “Start.”
Step 2
Next, use a parallelogram to indicate that the system asks the user to enter their username and password.
Step 3
Use a diamond to ask, “Are the username and password correct?” Add two arrows leading out—“Yes” and “No.”
Creating a Flowchart for a Scenario
Step 4
If yes, move to a rectangle that says “Grant access to homework portal.”
Step 5
If no, use another rectangle to say “Display error and ask user to try again.” Then link back to the step where the user inputs their details.
Step 6
Finally, close the flowchart with an oval or rounded rectangle labelled “End.”
You now have a simple visual representation of how a user logs into a school website. If you spot a problem, you can quickly adjust the flowchart to fix it before writing any actual code or instructions.
Lesson Summary
A flowchart is a visual plan showing steps and decisions in a process.
Flowcharts use standard shapes, like rectangles and diamonds, to represent different elements.
Flowchart components include Terminator, Data Flow, Process, Decision and Input/Output.
Specialist programs, such as Lucidchart and Microsoft Visio, can be used to create clear flowcharts.
Flowcharts offer clarity, efficient organisation, error detection, and easier communication for complex tasks.
Flowcharts may become outdated, complex, or lack deep detail if processes change frequently.
