Introduction
Flowcharts are a visual way to represent processes and decision-making.
They help to break down complex problems into smaller, manageable steps, making them an essential tool for planning, troubleshooting, and improving efficiency in IT systems.
Flowcharts are widely used in programming, system analysis, and business process design to illustrate the logical sequence of actions.
In this lesson, we’ll learn about:
- What a flowchart is and why it is important
- The key components of a flowchart
- How to draw a flowchart step by step
- Completing worked examples based on real-world scenarios

What is a Flowchart?
A flowchart is a diagram that represents a process, showing the sequence of steps and decisions needed to complete a task.
Flowcharts use different symbols to illustrate various actions, decisions, inputs, and outputs, making it easier to understand and communicate complex processes.
Why are flowcharts important?
- They simplify complex processes into easy-to-follow diagrams.
- They help in identifying inefficiencies and areas for improvement.
- They improve communication between developers, system analysts, and stakeholders.
- They assist in debugging and troubleshooting issues within a system.

Key Components
Flowcharts use standard symbols to represent different elements within a process. These include:
- Terminator
- Data Flow
- Process
- Decision
- Input/Output
Let’s look at each of these in more detail.

Key Components
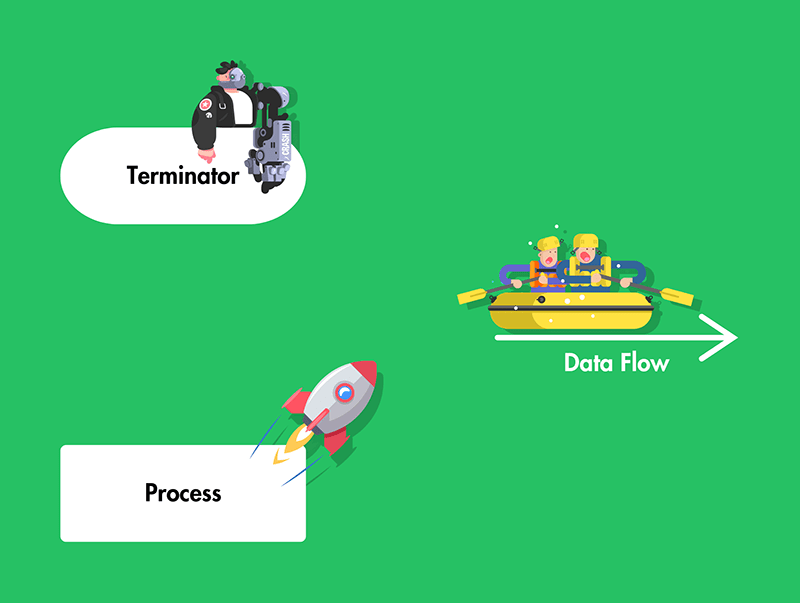
Terminator
This shape is usually an oval or rounded rectangle.
It tells you where the flowchart begins (Start) and ends (End).
Data Flow
Arrows show the direction of the process flow.
They help you trace the path from one step to the next.
Process
This shape is usually a rectangle.
It represents an action or step in the process.
Examples could include “Add two numbers” or “Display message.”
Key Components
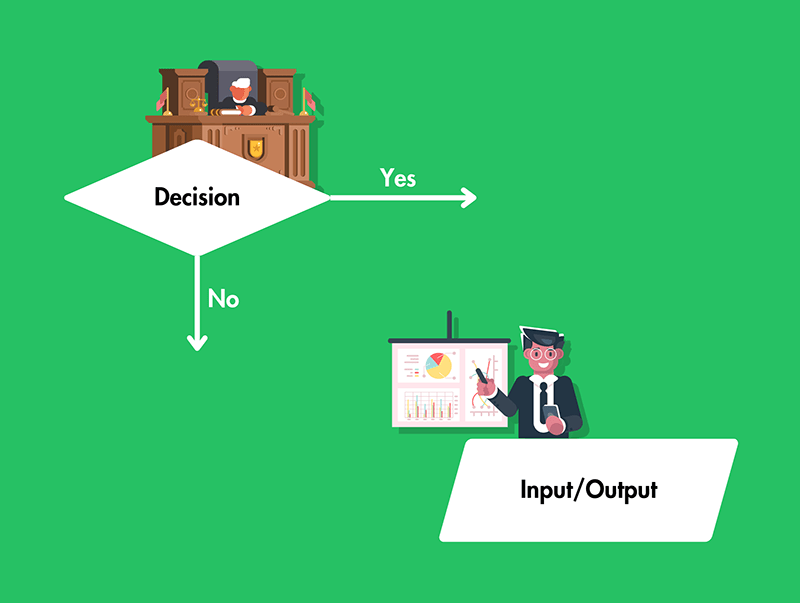
Decision
This shape is usually a diamond and represents a point where a question is asked.
The flow can split into different paths based on the answer—for example, “Is the user logged in? Yes or No?”
Input/Output
This shape is sometimes a parallelogram.
It indicates where data is entered into or returned from a process, like “Enter username” or “Show results.”
Quick Quiz: Flowcharts & Their Components
Creating a Flowchart
Step 1: Define the Process
- Identify the task or problem that the flowchart will represent.
- Determine the start and end points of the process.
Step 2: Identify Key Steps
- List the main steps required to complete the process.
- Break down complex tasks into smaller, manageable actions.

Creating a Flowchart
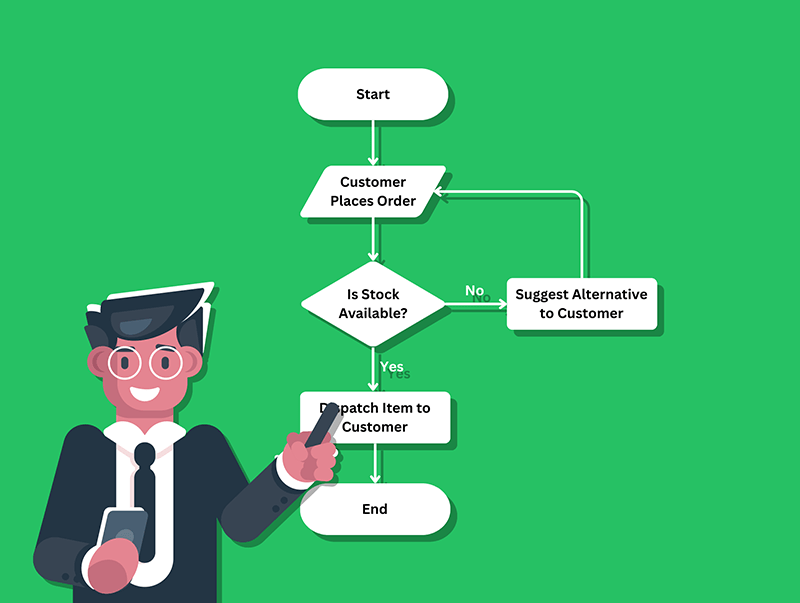
Step 3: Choose Flowchart Symbols
- Use the appropriate symbols for each type of action (e.g., rectangles for actions, diamonds for decisions).
- Ensure clarity by keeping the design simple and logical.
Step 4: Connect the Symbols
- Use arrows to indicate the direction of flow.
- Ensure the sequence is logical and easy to follow.
Quick Quiz: The Flowchart Process
Worked Example
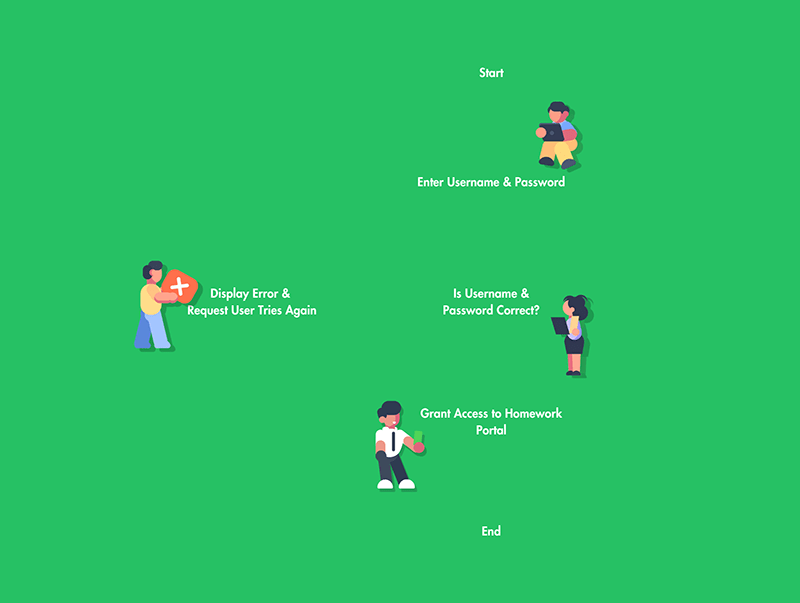
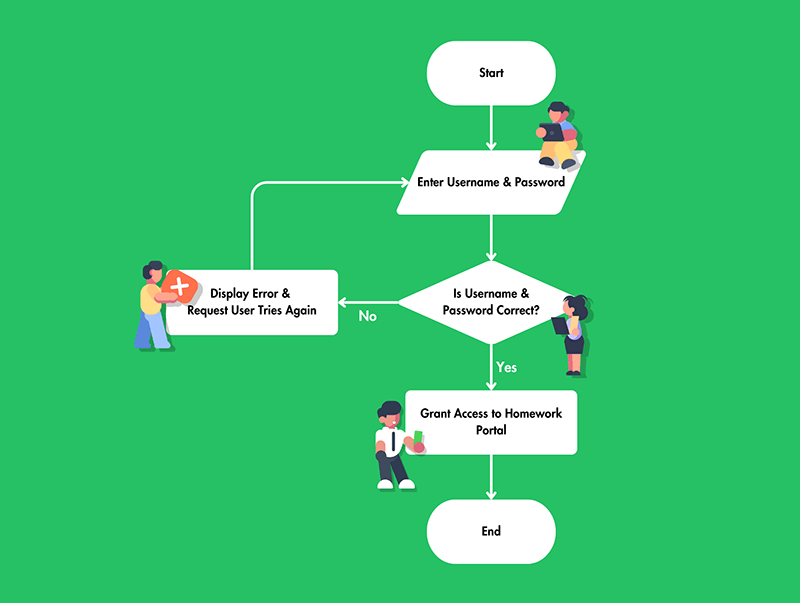
Scenario: Logging into a School Website
Let’s say you’ve been asked to design a login system for a school website.
Students need to type in their username and password to gain access to their homework portal.
Let’s look at how you could turn that into a flowchart step by step.

Worked Example
Step 1: Define the Process
- The process starts when a student tries to log in.
- It ends when they successfully log in or are locked out.
Step 2: Identify Key Steps
- The student enters a username and password.
- The system checks if the credentials are correct.
- If they’re correct, access is granted.
- If they’re incorrect, the student tries again.
Worked Example
Step 3: Choose Flowchart Symbols
- An oval for the start and end.
- A parallelogram for input (entering username and password).
- A diamond for a decision (checking credentials).
- A rectangle for process steps (grant access or try again request).
Step 4: Connect the Symbols
- The process starts with an oval labelled “Start.”
- An input parallelogram asks for the username and password.
- A diamond checks if the credentials are correct.
- If Yes, a rectangle grants access, leading to an oval labelled “End.
- If No, the process loops back for another attempt.
Quick Quiz: Creating a Flowchart
Lesson Summary
A flowchart is a diagram that represents a process, showing the sequence of steps and decisions required to complete a task.
Flowcharts are useful for simplifying complex processes, identifying inefficiencies, and improving communication.
The key components include Start/End (ovals), Processes (rectangles), Decisions (diamonds), Input/Outputs (parallelograms), and data flows (arrows).
Creating a flowchart involves defining the process, identifying key steps, selecting appropriate symbols and connecting the symbols logically.